Understaffed & Overrated: Nurse Staffing and Citations in California
How nurse staffing hours and staff turnover track with California nursing home citations—the best-staffed quartile records about 30% fewer citations.
Third in the NursingHomesCA.com data series. California law and the state Attorney General have made nursing-home staffing a central enforcement priority. The federal data shows why: staffing levels and staff turnover are among the strongest predictors of how often a California home gets cited — and how serious those citations are.
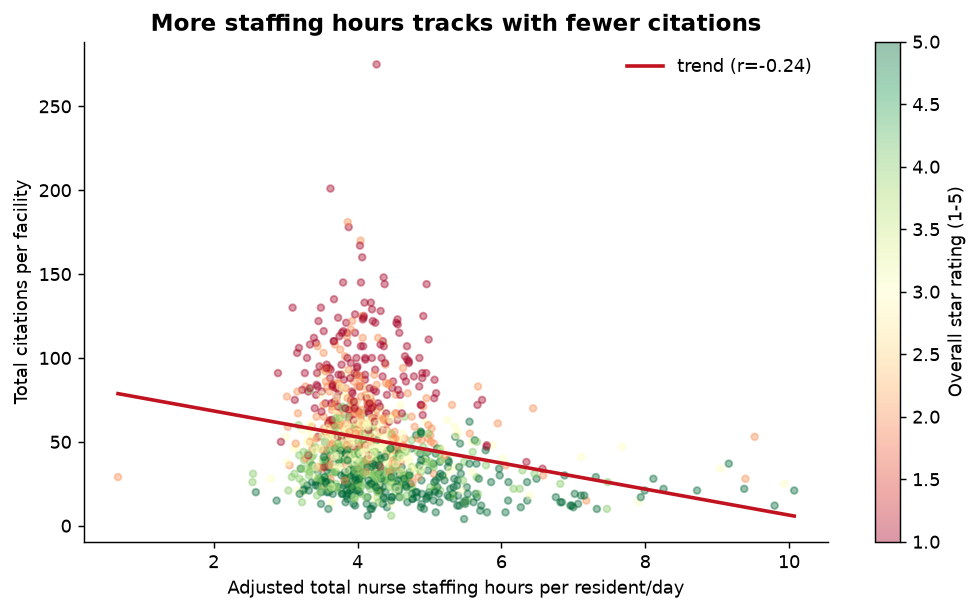
The dose-response in the data
Grouping all 1,127 California homes with reported staffing data into quartiles by adjusted total nurse staffing hours per resident per day:
| Staffing quartile | Homes | Citations / home | Serious / home | Avg. star |
|---|---|---|---|---|
| Q1 — lowest staffing | 282 | 54.1 | 1.07 | 2.94 |
| Q2 | 282 | 58.5 | 1.44 | 2.96 |
| Q3 | 281 | 51.0 | 1.33 | 3.04 |
| Q4 — highest staffing | 282 | 38.4 | 1.11 | 3.73 |
The best-staffed quartile records ~30% fewer citations than the statewide average — and carries a full star more in CMS's overall rating (3.73 vs ~2.95). The relationship is not perfectly linear at the low end, but the gap at the top is unmistakable.
Turnover is an even cleaner signal
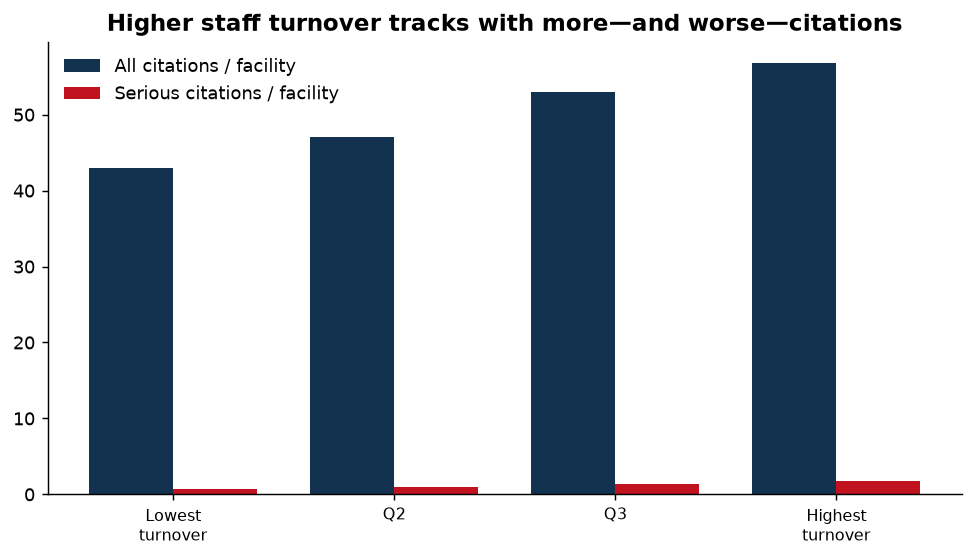
Grouping homes by total nursing staff turnover produces a near-perfect dose-response:
| Turnover quartile | Homes | Citations / home | Serious / home |
|---|---|---|---|
| Lowest turnover | 257 | 43.0 | 0.75 |
| Q2 | 246 | 47.1 | 0.94 |
| Q3 | 251 | 53.0 | 1.39 |
| Highest turnover | 252 | 56.8 | 1.72 |
Homes in the highest-turnover quartile record 2.3× the serious citations of the lowest-turnover group. A revolving door of nurses is not just a management problem — it shows up directly in the inspection record.
Correlations (all homes, n≈1,127)
| Variable | Correlation with total citations |
|---|---|
| Adjusted total nurse staffing hours/resident/day | −0.24 |
| Adjusted RN staffing hours/resident/day | −0.28 |
| Total nursing staff turnover | +0.21 |
| Registered Nurse turnover | +0.20 |
More nurse and RN hours correlate with fewer citations; higher turnover correlates with more. The RN-hours relationship is the strongest single staffing correlate in the data.
California context
- The statewide average in this dataset is 4.31 adjusted total nurse staffing hours per resident per day, and 0.61 adjusted RN hours per resident per day.
- Average nursing staff turnover is 36.7%; average RN turnover is 38.1% — meaning a typical California home replaces more than a third of its nursing workforce each year.
- 115 of 1,127 California homes (10%) report adjusted total nurse staffing below 3.5 hours per resident per day, the threshold California uses for its direct-care staffing standard (note: CMS measures nurse-only hours, so the two are not identical).
Methodology
- Staffing and turnover figures are the CMS-adjusted measures published in Provider Information (processing date 2026-08-01); citations are joined from Health Deficiencies by CCN.
- Quartiles are computed on homes with non-null staffing values; correlations use pairwise-complete observations.
- Correlation is not causation: case-mix, ownership and resident acuity all interact with staffing. These findings are associative.
Media enquiries: info@nursinghomesca.com, or use the contact form at nursinghomesca.com/contact.html.