Follow the Money: Fines, Chains and the For-Profit Gap
87% of California nursing homes are for-profit, averaging 68% more citations. Ownership, chains, repeat offenders and $28.7M in federal fines.
Fourth in the NursingHomesCA.com data series. California's nursing-home industry is overwhelmingly for-profit and increasingly chain-operated. The inspection and penalty data shows a measurable quality gap by ownership — and a handful of operators carrying an outsized share of the worst findings.
The for-profit gap
Of California's 1,165 certified nursing homes, 1,013 (87%) are for-profit — consistent with the California Health Care Foundation's long-standing finding of 84%.
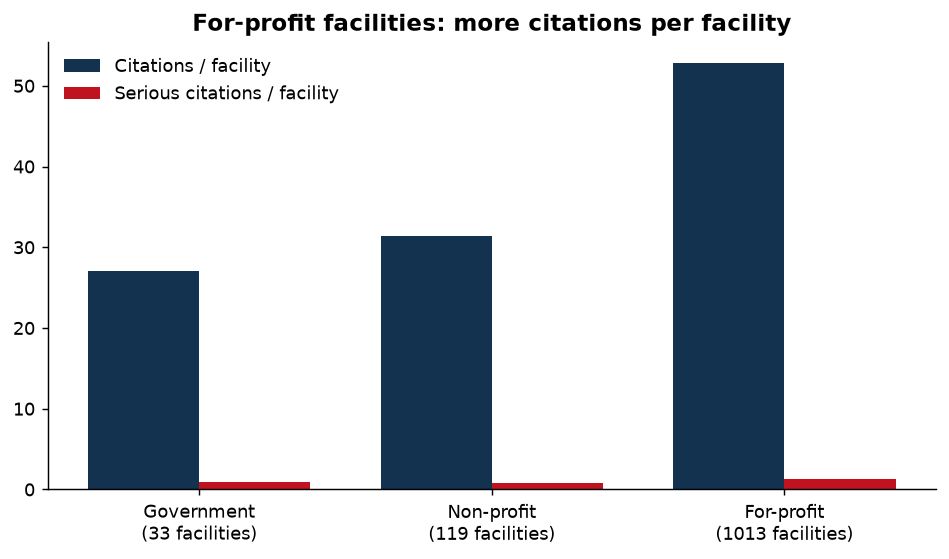
| Ownership class | Homes | Citations / home | Serious / home | Fines | Avg. star |
|---|---|---|---|---|---|
| For-profit | 1,013 | 52.8 | 1.28 | $26,218,963 | 3.04 |
| Non-profit | 119 | 31.4 | 0.78 | $1,883,267 | 3.94 |
| Government | 33 | 27.1 | 0.97 | $634,025 | 3.69 |
For-profit homes average 68% more citations and 64% more serious citations than non-profit homes, and account for 91% of all federal fines assessed in the state ($26.2M of $28.7M). For-profit homes average nearly a full star less in CMS's overall rating.
The most common corporate form is the limited liability company: 636 of the 1,013 for-profit homes are "For profit – Limited Liability company," followed by 284 corporations.
The chains with the worst per-home records
Grouping homes by CMS "Chain Name," among chains with four or more California homes, by serious (actual-harm or immediate-jeopardy) citations per facility:
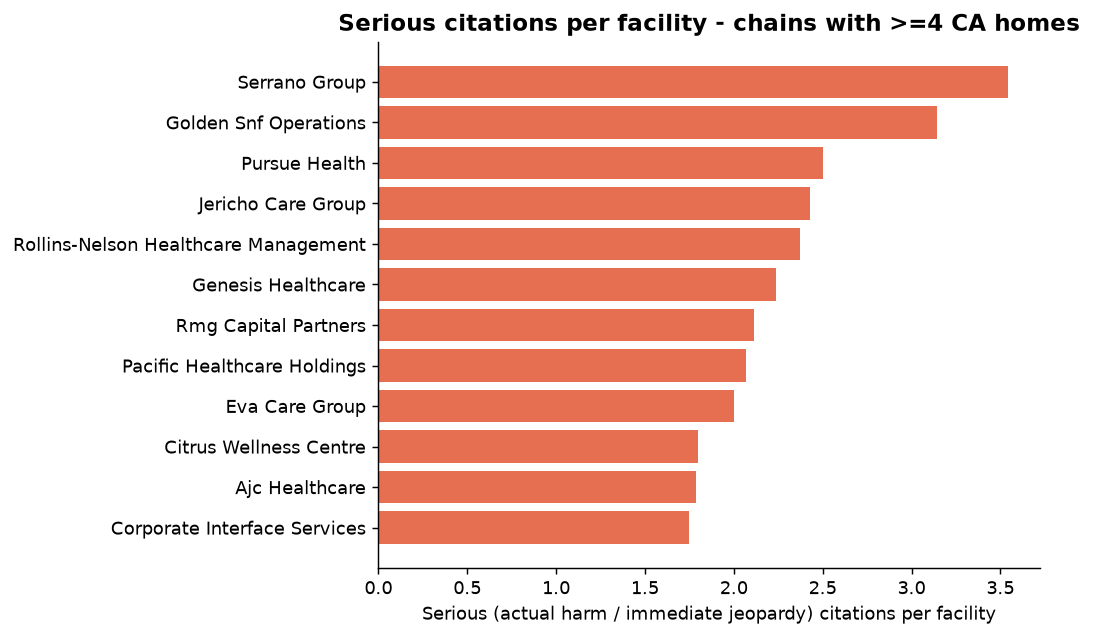
| Chain | CA homes | Citations | Serious | IJ | Fines | Serious/home | Avg. star |
|---|---|---|---|---|---|---|---|
| Serrano Group | 11 | 920 | 39 | 17 | $721,105 | 3.55 | 1.91 |
| Golden SNF Operations | 7 | 423 | 22 | 1 | $496,824 | 3.14 | 2.86 |
| Pursue Health | 6 | 486 | 15 | 7 | $584,643 | 2.50 | 1.83 |
| Jericho Care Group | 7 | 305 | 17 | 2 | $377,058 | 2.43 | 2.33 |
| Rollins-Nelson Healthcare Mgmt | 8 | 463 | 19 | 5 | $333,524 | 2.38 | 2.38 |
| Genesis Healthcare | 17 | 1,427 | 38 | 16 | $733,936 | 2.24 | 2.25 |
| RMG Capital Partners | 9 | 645 | 19 | 6 | $287,248 | 2.11 | 2.62 |
| Pacific Healthcare Holdings | 15 | 1,009 | 31 | 9 | $722,070 | 2.07 | 1.87 |
| Eva Care Group | 9 | 507 | 18 | 1 | $348,856 | 2.00 | 3.38 |
| Corporate Interface Services | 40 | 2,479 | 70 | 16 | $1,354,469 | 1.75 | 2.50 |
Serrano Group has the worst per-home severity rate of any sizeable chain — 3.55 serious citations per home, more than double the statewide per-home average — on a 1.91-star average. Corporate Interface Services (40 homes) has accrued $1.35 million in fines with 16 immediate-jeopardy citations.
But look at the biggest operators
California's largest chains by footprint are PACS Group (133 homes) and The Ensign Group (75 homes) — together nearly 18% of all California facilities:
| Chain | CA homes | Citations/home | Serious/home | Fines | Avg. star |
|---|---|---|---|---|---|
| PACS Group | 133 | 52.2 | 1.23 | $3,404,911 | 3.23 |
| The Ensign Group | 75 | 45.4 | 0.68 | $843,111 | 3.51 |
PACS Group alone accounts for $3.4 million in fines — 11.9% of every federal fine dollar assessed in California — while averaging 52 citations per home. Scale concentrates enforcement risk.
Repeat offenders: the facilities at the center of the data
Sorting facilities by serious citations reveals the homes where the system keeps finding harm:
| Facility | County | Cites | Serious | IJ | Fines | Star |
|---|---|---|---|---|---|---|
| Rio Hondo Subacute & Nursing Center | Los Angeles | 196 | 16 | 5 | $411,481 | — |
| Ararat Nursing Facility | Los Angeles | 144 | 13 | 5 | $407,175 | 1 |
| California Post Acute | Los Angeles | 125 | 12 | 5 | $164,203 | 1 |
| Maclay Healthcare Center | Los Angeles | 181 | 11 | 7 | $361,118 | 2 |
| Golden Modesto Care Center | Stanislaus | 74 | 10 | 0 | $182,248 | 2 |
| San Mateo Medical Center D/P SNF | San Mateo | 57 | 10 | 3 | $104,000 | 1 |
| Sunnyside Nursing Center | Los Angeles | 91 | 9 | 3 | $214,020 | 1 |
| Santa Anita Convalescent Hospital | Los Angeles | 178 | 8 | 4 | $234,187 | 1 |
| Imperial Care Center | Los Angeles | 99 | 8 | 4 | $212,749 | 1 |
| Glendora Grand, Inc | Los Angeles | 98 | 8 | 3 | $168,190 | 1 |
Seven of the ten most-cited facilities are in Los Angeles County. Maclay Healthcare Center recorded the most immediate-jeopardy citations of any facility (7) and also has 23 abuse/neglect citations — second-most in the state.
The fines
- $28,736,255 in federal civil money penalties, across 1,310 actions.
- Median fine: $15,652. 41 fines of $100,000+.
- Largest: $478,110 against Rancho Seco Care Center (Galt), Feb 2025 — a facility named in the Attorney General's Sweetwater Care litigation that settled for $15 million in 2026.
- PACS Group, California's largest operator (133 homes), accounts for $3.4M — 11.9% of all California fine dollars.
What this dataset is really showing
Three patterns run through all four studies:
- Ownership is a quality signal. The for-profit/non-profit gap is large, consistent, and visible in citations, serious citations, stars and fines.
- Problems cluster. A minority of homes and chains generate a majority of the worst findings — which means targeted enforcement can work, and informed families can avoid the homes that repeatedly fail.
- Staffing is the mechanism. The worst chains are also among the most understaffed and highest-turnover (see Study 3). Profit extracted at the staff line reappears as citations.
Methodology
- Ownership class derived from CMS
Ownership Type: "For profit," "Non profit," "Government." Chain grouping uses CMSChain Name; only chains with ≥4 CA homes shown. - Fines are federal civil money penalties (CMS Penalties file); fines by facility/chain are sums of all penalty events on record.
- "Serious" = severity G–L (actual harm or immediate jeopardy).
- Source: CMS Provider Data, processing date 2026-08-01. Derived from the public CMS datasets.
Media enquiries: info@nursinghomesca.com, or use the contact form at nursinghomesca.com/contact.html.