The California Nursing Home Risk Map
Which California counties have the most-cited nursing homes. Citations per home by county, from Orange and Kern to Los Angeles—and the safest counties.
Second in the NursingHomesCA.com data series. Nearly 90% of California's certified nursing homes are concentrated in a minority of its 58 counties — and the citation records those counties generate vary widely.
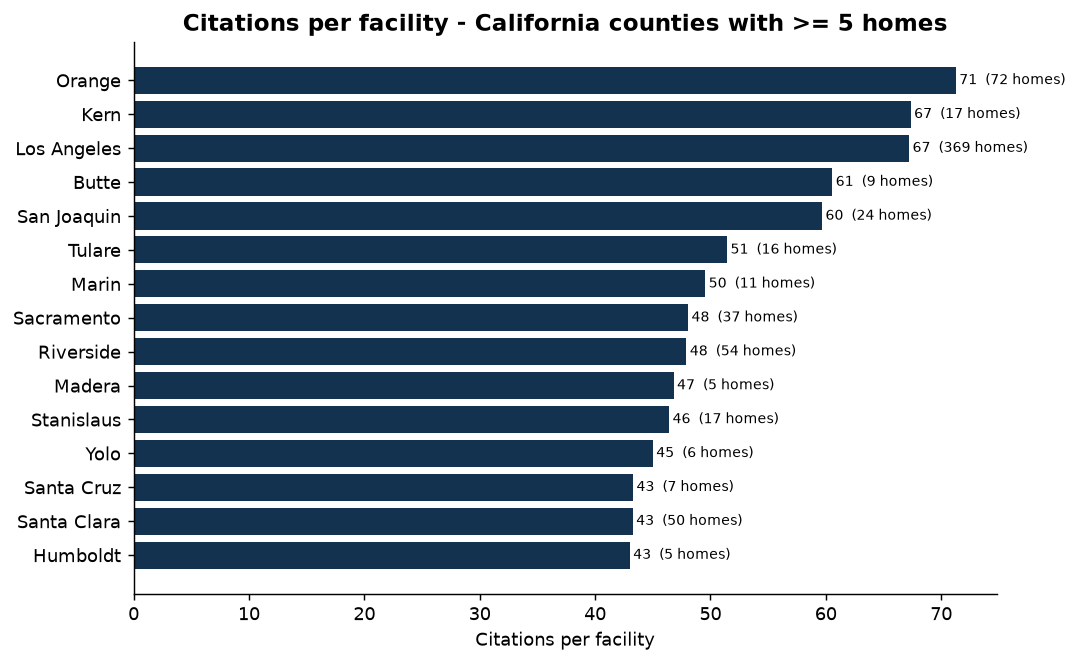
The county ranking
Among counties with five or more certified nursing homes (to avoid single-facility noise), average health-deficiency citations per home:
| Rank | County | Homes | Citations | Citations/home | Serious/home | Avg. star |
|---|---|---|---|---|---|---|
| 1 | Orange | 72 | 5,131 | 71.3 | 0.38 | 3.10 |
| 2 | Kern | 17 | 1,145 | 67.4 | 2.24 | 1.76 |
| 3 | Los Angeles | 369 | 24,803 | 67.2 | 1.94 | 2.46 |
| 4 | Butte | 9 | 545 | 60.6 | 1.78 | 2.22 |
| 5 | San Joaquin | 24 | 1,432 | 59.7 | 0.79 | 2.71 |
| 6 | Tulare | 16 | 823 | 51.4 | 0.88 | 3.06 |
| 7 | Marin | 11 | 545 | 49.6 | 2.00 | 3.09 |
| 8 | Sacramento | 37 | 1,778 | 48.1 | 0.73 | 3.31 |
| 9 | Riverside | 54 | 2,587 | 47.9 | 1.15 | 3.21 |
| 10 | Madera | 5 | 234 | 46.8 | 3.20 | 2.80 |
| 11 | Stanislaus | 17 | 789 | 46.4 | 2.00 | 3.06 |
| 12 | Yolo | 6 | 270 | 45.0 | 0.83 | 3.67 |
The safest records (fewest citations per home) belong to:
| County | Homes | Citations/home | Avg. star |
|---|---|---|---|
| San Luis Obispo | 7 | 11.9 | 5.00 |
| San Francisco | 18 | 24.5 | 4.28 |
| Nevada | 5 | 26.2 | 4.00 |
| Santa Barbara | 14 | 26.4 | 4.07 |
| Merced | 10 | 27.0 | 3.60 |
A home in San Luis Obispo County records, on average, six times fewer citations than a home in Orange County.
Three stories in this map
1. Los Angeles is the epicenter — by sheer weight
LA County holds 369 of California's 1,165 homes (32%) and 24,803 of its 58,141 citations (43%). Its homes average 1.94 serious (actual-harm or immediate-jeopardy) citations each — meaning the county that appears most often in this dataset carries a weighted share of the state's worst outcomes.
2. There are two different kinds of "high"
Orange County has the highest raw citations-per-home (71.3) but a low serious rate (0.38 per home) and a 3.1-star average — a pattern of many lower-severity paperwork and process findings. Kern (67.4 per home) and Madera (3.20 serious per home) show the opposite: fewer homes, but a far higher share of findings that involved harm. Volume and severity are not the same thing, and the most alarming counties are sometimes not the biggest.
3. Quality clusters regionally
The strongest records run through the Central Coast (San Luis Obispo, Santa Barbara) and the Bay Area (San Francisco, Santa Clara at 43.0). The weakest run through the Southern Inland Empire and Central Valley (Kern, San Bernardino, Madera, Stanislaus). This tracks the staffing and ownership patterns documented in studies 3 and 4.
Methodology
- Counties are drawn from the
County/Parishfield of CMS Provider Information, joined to each facility's deficiency citations by CCN. - The ranking is restricted to counties with ≥5 certified homes; California has many counties with one or two homes, where a single inspection can distort the average.
- "Serious/home" counts citations at severity G–L (actual harm or immediate jeopardy).
- Source: CMS Provider Data, processing date 2026-08-01. Derived from the public CMS datasets described above.
Media contact: info@nursinghomesca.com